Saturday, 28 April 2018

Monitoring the replay-only-window on a Db2 HADR standby database

- David Sciaraffa, Software Development Manager – IBM Db2


In Db2 systems configured for high availability disaster recovery (HADR), all data changes which are made on the primary database are also transmitted and replayed on one or more secondary ‘standby’ databases.  If a system failure occurs on the primary database server, applications can be rerouted to the standby database almost instantaneously (and usually done so through automation).
Db2 HADR is simple to configure, and mostly invisible to the applications accessing the database. There are many excellent resources online for getting started with HADR:
Step by Step Procedure to set up HADR replication between DB2 databases
IBM Developerworks Db2 HADR Wiki (Tutorial, Getting-Started, Performance Monitoring and Tuning, more…)


Performing SQL queries on a standby database (“Reads-on-Standby”) --
It is possible to allow applications to connect to the Db2 standby database and perform SQL read-only queries.  We refer to standby databases which are enabled for this as a “Reads-on-Standby” database.
Reads-on-Standby databases are simple to enable. There are numerous resources available to help get started:
Get the most from the DB2 HADR standby database: Using the reads on standby capability
HADR reads on standby feature
Reads on standby restrictions


Limitation of HADR Reads-on-Standby databases – the “replay-only-window”

A current limitation of Reads-on-Standby databases is the “replay-only-window”. When an application on the primary database performs a ‘DDL’ operation (such as creating or altering a regular or temporary table, view, or other database object) all application connections on the standby database will be momentary forced off (any currently executing queries will be interrupted). After the unit-of-work containing the DDL operation is fully replayed on the Standby database, application connections and queries on the standby database are permitted again.  The list of DDL and utility operations which trigger the replay-only-window are documented in Replay-only window on the active standby database.


What does a replay-only-window look like?

First, let’s establish a connection on the standby database, and start running some basic read-only queries:

[standby db server]

$ db2pd -db hadr105 -hadr | grep HADR_ROLE
                             HADR_ROLE = STANDBY

$ db2 connect to hadr105

   Database Connection Information

   Database server        = DB2/LINUXX8664 10.5.9
   SQL authorization ID   = DB2INST1
   Local database alias   = HADR105

$ while [[ 1 ]]
   do
   db2 -v "select FIRSTNME from EMPLOYEE with UR";
   done

Let’s invoke a simple DDL statement on the primary database, to trigger a replay-only-window on the standby database:

[primary db server]

$ db2pd -db hadr105 -hadr | grep HADR_ROLE
                            HADR_ROLE = PRIMARY

$ db2 create table table1 '(c1 int)'
DB20000I  The SQL command completed successfully.

When the replay-only-window is triggered on the standby database, all running queries on the standby database will be interrupted and their associated database connections will be forced off resulting in an SQL1224N error:

[standby db server]

$ db2 "select FIRSTNME from EMPLOYEE"
SQL1224N  The database manager is not able to accept new requests, has
terminated all requests in progress, or has terminated the specified request
because of an error or a forced interrupt.  SQLSTATE=55032

Also, if an attempt is made to establish a connection to the standby database while a replay-only-window is active, an SQL1776N reason 4 is returned:

[standby db server]

$ db2 connect to hadr1113
SQL1776N  The command cannot be issued on an HADR database. Reason code = "4".


How can I monitor the replay-only-window?

In all Db2 versions:
The STANDBY_REPLAY_ONLY_WINDOW_ACTIVE value of ‘db2pd –hadr’ or the MON_GET_HADR() table function will have a value of ‘Y’ on the standby database for the duration of the replay-only-window:

[standby db server]

$ db2pd –db hadr105 –hadr

                            HADR_ROLE = STANDBY
                           REPLAY_TYPE = PHYSICAL
                         HADR_SYNCMODE = NEARSYNC
                            STANDBY_ID = 0
                         LOG_STREAM_ID = 0
                            HADR_STATE = PEER
                            HADR_FLAGS = TCP_PROTOCOL
                   PRIMARY_MEMBER_HOST = hotellnx108
                     PRIMARY_INSTANCE = db2inst1
                       PRIMARY_MEMBER = 0
                   STANDBY_MEMBER_HOST = hotellnx111
                      STANDBY_INSTANCE = db2inst1
                       STANDBY_MEMBER = 0
                   HADR_CONNECT_STATUS = CONNECTED
              HADR_CONNECT_STATUS_TIME = 04/28/2018 18:55:38.089002 (1524956138)
           HEARTBEAT_INTERVAL(seconds) = 30
                      HEARTBEAT_MISSED = 0
                    HEARTBEAT_EXPECTED = 283
                 HADR_TIMEOUT(seconds) = 120
         TIME_SINCE_LAST_RECV(seconds) = 0
              PEER_WAIT_LIMIT(seconds) = 0
            LOG_HADR_WAIT_CUR(seconds) = 0.000
     LOG_HADR_WAIT_RECENT_AVG(seconds) = 0.000308
    LOG_HADR_WAIT_ACCUMULATED(seconds) = 1.909
                   LOG_HADR_WAIT_COUNT = 986
SOCK_SEND_BUF_REQUESTED,ACTUAL(bytes) = 0, 16384
SOCK_RECV_BUF_REQUESTED,ACTUAL(bytes) = 0, 87380
             PRIMARY_LOG_FILE,PAGE,POS = S0000002.LOG, 725, 55945845
             STANDBY_LOG_FILE,PAGE,POS = S0000002.LOG, 725, 55945845
                   HADR_LOG_GAP(bytes) = 0
      STANDBY_REPLAY_LOG_FILE,PAGE,POS = S0000002.LOG, 725, 55945789
        STANDBY_RECV_REPLAY_GAP(bytes) = 2
                      PRIMARY_LOG_TIME = 04/28/2018 21:17:06.000000 (1524964626)
                      STANDBY_LOG_TIME = 04/28/2018 21:17:06.000000 (1524964626)
               STANDBY_REPLAY_LOG_TIME = 04/28/2018 21:17:06.000000 (1524964626)
          STANDBY_RECV_BUF_SIZE(pages) = 512
              STANDBY_RECV_BUF_PERCENT = 0
           STANDBY_SPOOL_LIMIT(pages) = 13000
                 STANDBY_SPOOL_PERCENT = 0
                    STANDBY_ERROR_TIME = NULL
                  PEER_WINDOW(seconds) = 0
              READS_ON_STANDBY_ENABLED = Y
     STANDBY_REPLAY_ONLY_WINDOW_ACTIVE = Y
      STANDBY_REPLAY_ONLY_WINDOW_START = 04/28/2018 21:17:32.000000 (1524964652)
STANDBY_REPLAY_ONLY_WINDOW_TRAN_COUNT = 1


In Db2 version 11.1.2.2 and previous releases:
The db2 diagnostic log file (db2diag.log) on the standby database will contain the following messages:

[standby db server]

$ less /home/db2inst1/sqllib/db2dump/db2diag.log

2018-04-28-18.36.18.723755-240 E41445875E502         LEVEL: Warning
PID     : 483                  TID : 140327683876608 PROC : db2sysc
INSTANCE: dsciaraf             NODE : 000            DB   : HADR105
APPHDL  : 0-12                 APPID: *LOCAL.DB2.180428222707
HOSTNAME: hotellnx111
EDUID   : 685                  EDUNAME: db2redom (HADR105)
FUNCTION: DB2 UDB, base sys utilities, sqeLocalDatabase::HdrForceAppsInReplayOnlyWindow
, probe:100
DATA #1 : String, 28 bytes
Replay only window is active

2018-04-28-18.36.18.724354-240 I41446378E490         LEVEL: Info
PID     : 483                  TID : 140327683876608 PROC : db2sysc
INSTANCE: db2inst1             NODE : 000            DB   : HADR105
APPHDL  : 0-12                 APPID: *LOCAL.DB2.180428222707
HOSTNAME: hotellnx111
EDUID   : 685                  EDUNAME: db2redom (HADR105)
FUNCTION: DB2 UDB, base sys utilities, sqeLocalDatabase::HdrKickPooledAgents, probe:10
DATA #1 : <preformatted>
Interrupting agent with eduid:688

2018-04-28-18.36.18.724607-240 I41446869E500         LEVEL: Info
PID     : 483                  TID : 140327683876608 PROC : db2sysc
INSTANCE: db2inst1             NODE : 000            DB   : HADR105
APPHDL  : 0-12                 APPID: *LOCAL.DB2.180428222707
HOSTNAME: hotellnx111
EDUID   : 685                  EDUNAME: db2redom (HADR105)
FUNCTION: DB2 UDB, base sys utilities, sqeLocalDatabase::HdrKickPooledAgents, probe:20
DATA #1 : <preformatted>
Waiting for last disassociation from the db

When the replay-only-windows is completed, and applications allowed to reconnect to the standby database, the following db2diag.log message is displayed:

2018-04-28-18.36.18.973225-240 E41447370E539         LEVEL: Warning
PID     : 483                  TID : 140327683876608 PROC : db2sysc
INSTANCE: db2inst1             NODE : 000            DB   : HADR105
APPHDL  : 0-12                 APPID: *LOCAL.DB2.180428222707
HOSTNAME: hotellnx111
EDUID   : 685                  EDUNAME: db2redom (HADR105)
FUNCTION: DB2 UDB, base sys utilities, sqeLocalDatabase::HdrEndReplayOnlyWindow, probe:
210
DATA #1 : String, 73 bytes
Replay only window is inactive, connections to Active Standby are allowed

In addition to these db2diag.log entries, it is possible to parse db2 recovery log files to determine which log-records (if any) will cause a replay-only-window, by using the db2fmtlog_replayonlywindow tool, which can be downloaded from the Db2 HADR wiki here: (link). Since db2 recovery log files are mostly identical on both primary and standby databases, this tool can be run on log files resided on either database (or the log archive path):

[primary or standby db server]

$ db2 get db config for hadr105 | grep "Path to log files"
  Path to log files = /home/db2inst1/db2inst1/NODE0000/SQL00001/LOGSTREAM0000/

$ cd /home/db2inst1/db2inst1/NODE0000/SQL00001/LOGSTREAM0000/

$ db2fmtlog_replayonlywindow_linux 0-2

  |------|------------------------------------------------------------------------
   | LREC |  5171  000408D1  00000000029D
   |------|------------------------------------------------------------------------
   | LREC |                     Record LSO = 45190368
   |      |                     Record TID = 00000000029D
   |      |                         Action = DDL
   |------|------------------------------------------------------------------------
   | LREC |  5180  00040921  00000000037E
   |------|------------------------------------------------------------------------
   | LREC |                     Record LSO = 45197733
   |      |                     Record TID = 00000000037E
   |      |                         Action = DDL

Also, when the LOG_DDL_STMTS database configuration parameter is set to yes on the Primary database (at the time the DDL operation was performed and it’s log records were generated within the recovery log file), then the DDL statement itself will also be displayed:

  |------|------------------------------------------------------------------------
  | LREC |  5171  000408D1  00000000029D
  |------|------------------------------------------------------------------------
  | LREC |                     Record LSO = 45190368
  |      |                     Record TID = 00000000029D
  |      |                         Action = DDL
  |------|------------------------------------------------------------------------
  | LREC |  5171  000408D2  00000000029D
  |------|------------------------------------------------------------------------
  | LREC |                     Record LSO = 45190796
  |      |                     Record TID = 00000000029D
  |      |                  DDL Statement = create table t3 (c1 int)
  |------|------------------------------------------------------------------------
  | LREC |  5180  00040921  00000000037E
  |------|------------------------------------------------------------------------
  | LREC |                     Record LSO = 45197733
  |      |                     Record TID = 00000000037E
  |      |                         Action = DDL
  |------|------------------------------------------------------------------------
  | LREC |  5180  00040922  00000000037E
  |------|------------------------------------------------------------------------
  | LREC |                     Record LSO = 45198161
  |      |                     Record TID = 00000000037E
  |      |                 DDL Statement = create table t4 (c1 int)


In Db2 version 11.1.3.3 and newer releases:
The db2 diagnostic log file (db2diag.log) on the standby database has been enhanced to provide additional details when a replay-only-window occurs.  The frequency of these diagnostic messages can be configured using the DB2_HADR_REPLAY_ONLY_WINDOW_DIAGLEVEL registry variable.  A value of 0 meaning no additional diagnostic messages, a value of 1 meaning only the first log-record/DDL statement within the unit-of-work will be displayed, and a value of 2 means all log-records/DDL statements within the unit-of-work will be displayed.

[standby db server]

$ db2pd -db hadr1113 | grep HADR_ROLE
                             HADR_ROLE = STANDBY

$ less /home/db2inst1/sqllib/db2dump/db2diag.log

2018-04-28-19.31.28.182828-240 I41576483E762         LEVEL: Info
PID     : 8721                 TID : 140697919284992 PROC : db2sysc
INSTANCE: db2inst1             NODE : 000            DB   : HADR1113
APPHDL  : 0-11                 APPID: *LOCAL.DB2.180428225527
HOSTNAME: hotellnx111
EDUID   : 397                  EDUNAME: db2redom (HADR1113)
FUNCTION: DB2 UDB, recovery manager, SQLP_REPLAY_ONLY_WINDOW_STAT::sqlpStartHadrReplayOnlyWindow,
probe:9140
MESSAGE : Replay only window is triggered by this log record: LogStreamId / TID
           / LSO / action
DATA #1 : db2LogStreamIDType, PD_TYPE_DB2_LOG_STREAM_ID, 2 bytes
0
DATA #2 : SQLP_TID, PD_TYPE_SQLP_TID, 6 bytes
00000000029D
DATA #3 : unsigned integer, 8 bytes
45190368
DATA #4 : String, 3 bytes
DDL

2018-04-28-19.31.28.183183-240 E41577246E504         LEVEL: Warning
PID     : 8721                 TID : 140697919284992 PROC : db2sysc
INSTANCE: dsciaraf             NODE : 000            DB   : HADR1113
APPHDL  : 0-11                 APPID: *LOCAL.DB2.180428225527
HOSTNAME: hotellnx111
EDUID   : 397                  EDUNAME: db2redom (HADR1113)
FUNCTION: DB2 UDB, base sys utilities, sqeLocalDatabase::HdrForceAppsInReplayOnlyWindow, probe:100
DATA #1 : String, 28 bytes
Replay only window is active

2018-04-28-19.31.28.183344-240 I41577751E502         LEVEL: Info
PID     : 8721                 TID : 140697919284992 PROC : db2sysc
INSTANCE: dsciaraf             NODE : 000            DB   : HADR1113
APPHDL  : 0-11                 APPID: *LOCAL.DB2.180428225527
HOSTNAME: hotellnx111
EDUID   : 397                  EDUNAME: db2redom (HADR1113)
FUNCTION: DB2 UDB, base sys utilities, sqeLocalDatabase::HdrKickPooledAgents, probe:20
DATA #1 : <preformatted>
Waiting for last disassociation from the db

And same as previous releases, when the replay-only-windows is completed, and applications allowed to reconnect to the standby database, the following db2diag.log message is displayed:

2018-04-28-19.31.28.375434-240 E41579289E541         LEVEL: Warning
PID     : 8721                 TID : 140697919284992 PROC : db2sysc
INSTANCE: dsciaraf             NODE : 000            DB   : HADR1113
APPHDL  : 0-11                 APPID: *LOCAL.DB2.180428225527
HOSTNAME: hotellnx111
EDUID   : 397                  EDUNAME: db2redom (HADR1113)
FUNCTION: DB2 UDB, base sys utilities, sqeLocalDatabase::HdrEndReplayOnlyWindow, probe:210
DATA #1 : String, 73 bytes
Replay only window is inactive, connections to Active Standby are allowed

Also, when the LOG_DDL_STMTS database configuration parameter is set to yes on the Primary database (at the time the DDL operation was performed and it’s log records were generated within the recovery log file and transmitted to the standby database), then the DDL statement will also be printed into the db2diag.log starting in v11.1.3.3 and new releases:

2018-04-28-19.31.28.183524-240 I41578254E544         LEVEL: Info
PID     : 8721                 TID : 140697919284992 PROC : db2sysc
INSTANCE: dsciaraf             NODE : 000            DB   : HADR1113
APPHDL  : 0-11                 APPID: *LOCAL.DB2.180428225527
HOSTNAME: hotellnx111
EDUID   : 397                  EDUNAME: db2redom (HADR1113)
FUNCTION: DB2 UDB, recovery manager, SQLP_REPLAY_ONLY_WINDOW_STAT::sqlpSetDDLStmtForHadrReplayOnly
Window, probe:9150
MESSAGE : DDL statement text
DATA #1 : String, 24 bytes
create table table3 (c1 int)

In addition, available in v11.1.3.3 and newer releases, the db2fmtlog tool is available in the sqllib/bin/ folder, and it’s REPLAYONLYWINDOW option can be used to display all log records (if any) that will cause a replay-only-window.  If the LOG_DDL_STMTS database configuration parameter is set to yes on the Primary database (at the time the DDL operation was performed and it’s log records were generated), then the statement itself is displayed as well:

[primary or standby db server]

$ db2 get db config for hadr105 | grep "Path to log files"
  Path to log files = /home/db2inst1/db2inst1/NODE0000/SQL00001/LOGSTREAM0000/

$ cd /home/db2inst1/db2inst1/NODE0000/SQL00001/LOGSTREAM0000/

$ ~/sqllib/bin/db2fmtlog -replayonlywindow 0-10

|------|------------------------------------------------------------------------
| LREC |                     Record LSO = 45190796
|      |                     Record TID = 00000000029D
|      |                  DDL Statement = create table t3 (c1 int)
|------|------------------------------------------------------------------------
| LREC |  5180  00040921  00000000037E
|------|------------------------------------------------------------------------
| LREC |                     Record LSO = 45197733
|      |                     Record TID = 00000000037E
|      |                         Action = DDL
|------|------------------------------------------------------------------------
| LREC |  5180  00040922  00000000037E
|------|------------------------------------------------------------------------
| LREC |                     Record LSO = 45198161
|      |                     Record TID = 00000000037E
|      |                  DDL Statement = create table t4 (c1 int)


How can the replay-only-window be avoided?

In Db2 version 11.1.3.3 and prior releases, the database administrator should implement monitoring for replay-only-window’s. Should the replay-only-windows occur frequently enough to hinder application productivity (or increase in frequency over time), then the DDL statements causing replay-only-windows should be determined (as described above), and applications teams should be engaged to determine if these DDL statements can be reduced in frequency.

Application’s which perform queries against the standby database should plan to expect SQL1224N errors on occasion (due to the replay-only-window), and implement handling to automatically re-connect to the database and re-submit and interrupted query.


Stayed tuned for a drastic improvement which eliminates the replay-only-window in a future Db2 version.


I hope this information is useful. If you have any thoughts or questions, feel free to submit a comment below.





Monday, 16 April 2018

Format and display Db2 log file information using db2fmtlog

- David Sciaraffa, Software Development Manager – IBM Db2


In high performance database (and data storage) systems, the hardening of data changes to permanent storage (disk) is often managed by algorithms which batch many changes together into fewer larger I/O operations. This is meant to minimize the exponential cost disparity between cpu/memory versus I/O, to optimize performance. 

Db2 write-ahead logging strategy
In order to achieve durability (in the case of a system failure) for data changes which reside in-memory but have not yet been written to permanent storage, many systems utilizes a write-ahead logging protocol – meaning that information pertaining to a data change is written to special transaction log files on permanent storage, before those corresponding data changes are batched together and written to disk. Examples of write-head logging protocols are abundant in mainstream IT systems, such as in journaled file systems, volume managers, and database management systems, such as Db2.


Db2 recovery log files
The Db2 recovery log files are a fundamental aspect of database tuning and administration, and all Database Administrators should have basic familiarity with log files. Db2’s recovery logs are well documented in both configuration and management, a few useful starting points provided here:

IBM DB2 Knowledge Center – Database Logging: https://www.ibm.com/support/knowledgecenter/en/SSEPGG_11.1.0/com.ibm.db2.luw.admin.ha.doc/doc/c0006073.html
Managing Db2 transaction log files: http://db2commerce.com/2011/05/04/managing-db2-transaction-log-files/


Administration tasks requiring log files
It’s not uncommon for a Database Administrator to perform some manual manipulation of Db2 recovery log files, usually the result of a support ticket, or recovery event. As an example, a DBA might be required to restore a database backup image to a secondary system, and perform a rollforward of all log file data to a point in time, in which case a DBA may need to manually copy active and/or archived recovery log files to another system.

A log file’s name does not tell us much about the log file itself. For example, consider log file “S0000117.LOG”. We know this is the 117th log file generated in sequence since the database was created, but not much else.  Sometimes, high level information about log files is required, such as knowing the database which a log file belongs to, whether the log file is compressed or encrypted, or other details often useful for Db2 customer support in problem determination.


Starting in version 11.1.3.3, the db2fmtlog tool is available in the ~/sqllib/bin folder of the db2 instance owner userid home path.


db2fmtlog tool

The db2fmtlog tool takes a log file sequence number (or range of numbers) as an input parameter, and displays high level information about the log file(s):

$ cd ~/path_where_some_log_files_reside/

$ ls -l
-rw------- 1 db2inst1 db2grp1 4104192 Apr 14 13:46 S0000117.LOG
-rw------- 1 db2inst1 db2grp1 4104192 Apr 14 13:46 S0000118.LOG
-rw------- 1 db2inst1 db2grp1 4104192 Apr 14 13:48 S0000119.LOG
-rw------- 1 db2inst1 db2grp1 4104192 Apr 14 13:52 S0000120.LOG
-rw------- 1 db2inst1 db2grp1 4104192 Apr 14 14:01 S0000121.LOG
…etc…


$ /home/db2inst1/sqllib/bin/db2fmtlog 117-118

Log File S0000117.LOG:
    Extent Number              117
    Format Version             14
    Architecture Level Version V:11 R:1 M:3 F:3 I:0 SB:0
    Encrypted                  Yes
    Compression Mode           OFF
    Number of Pages            1000
    Partition                  0
    Log Stream                 0
    Database Seed              1610235396
    Log File Chain ID          0
    Master Key Label           DB2_SYSGEN_db2inst1__2018-04-16-09.31.20_24111712
    Previous Extent ID         2018-04-14-17.01.44.000000 GMT
    Current Extent ID          2018-04-14-17.01.45.000000 GMT
    Database log ID            2018-04-05-16.35.08.000000 GMT
    Topology Life ID           2018-04-05-16.35.08.000000 GMT
    First LFS/LSN              10400/000000000004700A
    Last LFS/LSN               10594/000000000004D99F
    LSO range                  61140001 to 65216000

Log File S0000118.LOG:
    Extent Number              118
    Format Version             14
    Architecture Level Version V:11 R:1 M:3 F:3 I:0 SB:0
    Encrypted                  Yes
    Compression Mode           OFF
    Number of Pages            1000
    Partition                  0
    Log Stream                 0
    Database Seed              1610235396
    Log File Chain ID          0
    Master Key Label           DB2_SYSGEN_db2inst1__2018-04-16-09.31.20_24111712
    Previous Extent ID         2018-04-14-17.01.45.000000 GMT
    Current Extent ID          2018-04-14-17.01.46.000000 GMT
    Database log ID            2018-04-05-16.35.08.000000 GMT
    Topology Life ID           2018-04-05-16.35.08.000000 GMT
    First LFS/LSN              10594/000000000004D9A0
    Last LFS/LSN               Unset
    LSO range                  65216001 to 69292000


The information displayed contains the following fields:

Extent Number –
The log file sequence number, which is also evident within the log file name.

Format Version –
An [internal] log file structure version number.

Architecture Level Version –
The version of Db2 when the log file was generated (V=Version, R=Release, M=Modification, F=Fixpack, I=iFix, SB=Special Build#)

Encrypted –
Whether the log file (and database) are natively encrypted. (See ‘Master Key Label’ for the associated key label).

Compression Mode –
Whether the log file is compressed (possible values are: OFF, ON, NX842, ZLIB, Unknown).

Number of Pages –
The number of 4k log pages within the log file. This will usually reflect the LOGFILSZ db config parameter, but can be smaller when log files are truncated.

Partition –
The database partition number where this log file was generated. (Always 0 for non-partitioned databases).

Log Stream –
The log stream number associated with the member where this log file was generated. (Always 0 for non-pureScale databases).

Database Seed –
The unique database identifier. (You can use db2ckbkp to display the database seed of a backup image).

Log File Chain ID –
The log chain number. (Db2 will begin a new log chain when a restore+rollforward is completed to a point in time that is not the end of the full log stream).

Master Key Label –
The master key label. (Displayed when a database, and it’s corresponding log files, are natively encrypted).

Previous Extent ID –
A unique timestamp identifier for the previous log file in the sequence.

Current Extent ID –
A unique timestamp identifier for the current log file.

Database log ID –

A unique timestamp identifier for the database from which this log file was generated.

Topology Life ID –

A unique timestamp representing the database topology (formation of pureScale members) when this log file was generated.

First LFS/LSN –
The unique Log Flush Sequence number and Log Sequence Number of the first log record within this log file. [This field is generally not useful for Database Administrators, but could be useful to a Db2 Support analyst].

Last LFS/LSN –
The unique Log Flush Sequence number and Log Sequence Number of the last log record within this log file. [This field is generally not useful for Database Administrators, but could be useful to a Db2 Support analyst].

LSO range –
The range of log record Log Sequence Offsets within this log file. [This field is generally not useful for Database Administrators, but could be useful to a Db2 Support analyst].


In addition to the log file information displayed by db2fmtlog, there are additional options:

LSNRANGE
- Displays only the first, last LFS/LSN ranges, and LSO range for each log file.

REPLAYONLYWINDOW
- Displays all log records which cause “replay only windows” in HADR Reads-on-Standby (ROS) environments. In addition, if the LOG_DDL_STMTS db config parameter was enabled at the time the log file was generated, then the DDL statement text will also be displayed.


For additional details about these options, and the db2fmtlog tool, please see: http://www-01.ibm.com/support/docview.wss?uid=swg22014054


I hope this information is useful. If you have any thoughts or questions, feel free to submit a comment below.

Saturday, 31 March 2018

Faster rollback processing of very large transactions in Db2 v11.1.3.3

- David Sciaraffa, Software Development Manager – IBM Db2


In database management systems, it is common for periodic batch workloads to perform large quantities of insert, update, or delete operations. These are often referred to as the ‘nightly batch job’. These large batch processing operations can put pressure on database management resources.

In Db2, to satisfy the Durability property of ACID compliance, all insert/update/delete (i/u/d) of data rows are also recorded into the database recovery log files. This log file data may be required later to recover from system failure, interrupt, or for replication purposes. For large batch operations, log file data often spans many log files.

Diagram 1) depicts how large batch operations can generate log records that span multiple log files:

image


Note: Db2 recovery log files exploit Direct I/O and bypass the file system cache in order to optimize write performance. This is imperative given the performance sensitivity of writing log file data, and useful since there is minimal read activity of the recovery log files during database runtime.

As a common best practice, large batch operations should be divided into smaller batches, with explicit COMMIT operations performed after each small batch, to avoid filling the Db2 active log space, and to lessen the amount of work to undo or redo in case of an interrupt or failure. Nevertheless, large batch operations often exist, and can be interrupted, either intentionally by the user or unintentionally as the result of being forced off the database by workload management enforcement settings.

When large batch operations are interrupted or fail, potentially large quantities of data row changes must be rolled back or undone. This requires reading through all the transaction log data that was recorded into the recovery log files since the beginning of the batch job.  Since Db2 recovery log files use Direct I/O during database runtime (not crash-recovery), Db2 does not benefit from file system prefetching and caching when reading back these log-records.

Starting in Db2 Version 11.1.3.3, there is a significant performance improvement for rollback processing during database runtime for large units of work, through the autonomous use of filesystem caching (buffered I/O) when reading recovery log file data.

By autonomously re-opening log files with file system caching (buffered I/O), reading log data from these files benefits from the buffering of the file system cache.

Diagram 2) depicts how rollback processing of large units of work may benefit from buffered I/O when reading transaction log data back, in order to undo data row changes:

image


Internal tests showed significant improvements (up to a 3x!) in rollback processing time for very large transactions.

image


This improvement is available by default starting in v11.1.3.3, no configuration or registry settings need to be enabled.


I hope this information is useful. If you have any thoughts or questions, feel free to submit a comment below.

Monday, 26 March 2018

Db2 and Db2-on-Cloud - Technical Advocate Newsletter – March 2018

image_thumb2


Event - Relive 'Think 2018' Conference
The visionary speakers and experts at Think 2018 have shared their solutions for some of the world’s most daunting challenges. And now you can access their technical prowess and profound insights anytime.
https://ibm.co/2GrrGLE


Announcement - Db2 11.1 Mod Pack 3 is Available for Download
Summary of the modification pack: https://ibm.co/2tSYbby
List of high impact & pervasive (HIPER) fixes (APARs): https://ibm.co/2ze6H7L
List of all fixes (APARs) included in this fixpack: http://www-01.ibm.com/support/docview.wss?uid=swg21995889
Fixpack download page: https://ibm.co/2IUa895


Announcement - Introducing IBM Cloud Private for Data
IBM Cloud Private for Data is an engineered solution for data science, data engineering and application building, with no assembly required. It provides seamless access to data across on-premises and all clouds; a cloud-native data architecture, behind the firewall; and data ingestion rates of up to 250 billion events per day. What Kubernetes solved for application developers (dependency management, portability, etc), IBM Cloud Private for Data will solve for data developers and speed the journey to AI. For details: https://ibm.co/2pG6VSz


Anniversary -
Celebrating 25 years of Db2!
March 2018 is the 25th anniversary of the Db2 relational database product on Linux UNIX and Windows! Few tech products in the world grow to this kind of success. The world runs on the back of Db2 — stock markets, investment banks, hospitals, insurance firms, pension funds, manufacturers, retailers, railways, shipping and logistics companies, airlines, schools, and governments. A talented team of business leaders, strategists, engineers, researchers and innovators, support staff, and sales professionals has made it happen. Today we celebrate and tip our hats to a remarkable technology and the team that created it.
https://ibm.co/2DWmMAL


Webinar -
Favorite Tuning Tips & Tricks for Db2
SELECTIVITY, OPTGUIDELINES, Runstats, Indexes, Bufferpool Design, REORGs, monitoring advice, and more!! No wonder Joe Geller won Best User Speaker at IDUG Lisbon 2017! Joe's presentation is full of terrific advice and tips! Watch and learn...
http://bit.ly/2GpHpL9


Walkthrough - Db2 on Cloud - Free Tier
IBM Db2 on Cloud is built for robust performance and provides a high availability option with a 99.99% up-time SLA. Scale up or down as needed and leverage rolling security updates for peace of mind. Db2 on Clound is a fully managed service; scale CPU up or down and pay for what you use on a daily basis. You can also scale CPU and storage independently. Enables you to move to the cloud with Db2 and Oracle PL/SQL compatibility. Offers support for numerous data connectivity methods and types. Helps you comply with data protection laws. Includes at-rest database encryption and SSL connections. High availability plans provide seamless rolling security updates.
https://www.ibm.com/cloud/db2-on-cloud


Conference - 2018 North America - International Db2 User Group Tech Conference
The premier North America Db2 Conference will take place on April 29 - May 3, 2018 in Philadelphia, Pennsylvania. Make your plans to attend and experience the latest in Db2 technologies, networking opportunities and the technical content you need to be successful.
The 2018 event offers new educational opportunities and more training than ever before! Attendees will experience: Five days of education sessions; Half and full-day workshops; More than 100 one-hour technical sessions; Three expert panels on z/OS, LUW & Application Development.
And much more!
http://www.idug.org/na2018

__________________________________________________________________________


Support Community - Follow the IBM Support Community

Check out how IBM is improving your Db2 support experience!
http://ow.ly/rPsM30fHnwI
Wiki - Db2 Development-Advocate Wiki

The Db2 Development Advocate Wiki is a publically accessible wiki with information about the development advocacy program, and forums for Q&A about the program. You'll also find a list of historic newsletter content.
https://www.ibm.com/developerworks/community/groups/community/Db2_Technical_Advocacy_Program


Follow-us! - Stay up to date on the latest news from the Db2 team
Db2 Support Twitter channel: @AskIBMAnalytics (https://twitter.com/AskIBMAnalytics)
Facebook page: @DB2Community (https://www.facebook.com/DB2community/)
AskIBMAnalytics Facebook channel: @AskIBMAnalytics (https://www.facebook.com/AskIBMAnalytics/)
developerWorks Answers (forum): https://developer.ibm.com/answers/topics/
Thoughts from Db2 Support (blog): https://www.ibm.com/developerworks/community/blogs/IMSupport?lang=en
Db2 Technical Advocacy Wiki: https://www.ibm.com/developerworks/community/groups/community/Db2_Technical_Advocacy_Program

Wednesday, 24 January 2018

Db2 and Db2-on-Cloud - Technical Advocate Newsletter – January 2018


image_thumb2[3]


Event - 4 Reasons to Attend IBM 'Think 2018' (March 19-22, 2018, Las Vegas, NV)
The event where the problems of tomorrow meet the minds of today. Discover how you can realize exponential outcomes through the power of IBM.
Cloud - Watson - Data - Security - IOT
https://ibm.co/2DCfNAR


Announcement: Db2 11.1 Mod 2 Fixpack 2 iFix002 is Available for Download
Summary of the fixpack: https://ibm.co/2tSYbby
List of high impact & pervasive (HIPER) fixes (APARs): https://ibm.co/2ze6H7L
List of all fixes (APARs) included in this fixpack: https://ibm.co/2sZuAAw
Fixpack download page: https://ibm.co/2F6qGIq


Flash Alert -
CPU (Meltdown/Spectre) Architectural Design Flaws - Additional Guidance for Db2 Customers
IBM has published overall summaries on the CPU vulnerability recently disclosed by Google (see links below), commonly referred to as spectre / meltdown. This note contains additional context for Db2 customers. At this time, we are not aware of any specific security exposures within Db2 itself on this issue.
For more details, see: https://ibm.co/2rxFjT0


Webinar -
The 5 W's of High Availability Disaster Recovery (HADR)
Dale McInnish, IBM STSM, walks through the 5 W's of HADR -- What is HADR? Why should you use HADR? Where should HADR be deployed? When should you use HADR? Who is using HADR? And, bonus, How is HADR being used by Db2 Customers?
Download the video replay: http://bit.ly/2rwFT3F


Webinar -
Awaken your Data with RESTful Access to Db2!
The new IBM Data Server Gateway for OData is a standards-based way for customers to leverage Db2 in modern Cloud and Mobile application development environments without requiring database drivers on the client. George Baklarz, IBM Program Director, describes what OData is, how it works with RESTful calls, and what you need to get it working in your environment.
Download the video replay: http://bit.ly/2F6gQWR


Tutorial Blog -
The Need for Speed: How to Move your Data from Ground to Cloud
Database services in the cloud are gaining increasing popularity for development, test, and production systems. One of the key technical challenges for cloud database adoption is fast and secure movement of large data volumes into the cloud. In this article, Matthias Nicola presents 7 methods for moving data into Db2 on Cloud, Db2 Warehouse on Cloud, and Db2 Hosted. We discuss the pros and cons of each of these methods in terms of performance and functional capabilities and conclude with guidelines that help you choose the right method for your needs.
http://bit.ly/2n4Lklo


Technote -
What's New in IBM Db2 Warehouse on Cloud, IBM Db2 Warehouse, and IBM Db2 on Cloud
This technote provides a frequently refreshed list of new feature and function in the current releases of IBM® Db2 Warehouse on Cloud, IBM Db2 Warehouse, and IBM Db2 on Cloud.
https://ibm.co/2n5AOdI


Conference -
2018 North America - International Db2 User Group Tech Conference
The premier North America Db2 Conference will take place on April 29 - May 3, 2018 in Philadelphia, Pennsylvania. Make your plans to attend and experience the latest in Db2 technologies, networking opportunities and the technical content you need to be successful.
The 2018 event offers new educational opportunities and more training than ever before! Attendees will experience: Five days of education sessions; Half and full-day workshops; More than 100 one-hour technical sessions; Three expert panels on z/OS, LUW & Application Development.
And much more!
http://www.idug.org/na2018

__________________________________________________________________________


Support Community - Introducing the IBM Support Community
Check out how IBM is improving your Db2 support experience!
http://ow.ly/rPsM30fHnwI


Wiki -
Db2 Development-Advocate Wiki
The Db2 Development Advocate Wiki is a publicly accessible wiki with information about the development advocacy program, and forums for Q&A about the program. You'll also find a list of historic newsletter content.
https://www.ibm.com/developerworks/community/groups/community/Db2_Technical_Advocacy_Program


Follow-us!
Stay up to date on the latest news from the Db2 team
Db2 Support Twitter channel: @AskIBMAnalytics (https://twitter.com/AskIBMAnalytics)
Facebook page: @DB2Community (https://www.facebook.com/DB2community/)
AskIBMAnalytics Facebook channel: @AskIBMAnalytics (https://www.facebook.com/AskIBMAnalytics/)
developerWorks Answers (forum): https://developer.ibm.com/answers/topics/
Thoughts from Db2 Support (blog): https://www.ibm.com/developerworks/community/blogs/IMSupport?lang=en
Db2 Technical Advocacy Wiki: https://www.ibm.com/developerworks/community/groups/community/Db2_Technical_Advocacy_Program

Friday, 13 October 2017

Don't Get Caught Unprepared - Monitor Invalid Tablespaces on your HADR Standby database and Repair Them Efficiently.

- David Sciaraffa, Software Development Manager – IBM Db2 Availability


The Db2 High Availability Disaster Recovery feature, better known as HADR, is a database replication solution for disaster recovery. There are few database administrators in the world unfamiliar with HADR, being one of the most successful and widely deployed Db2 features.


While application changes are not required to deploy HADR, and up-and-running is quick and simple, database administrators should accommodate the extra monitoring required to assure the health of the standby database. The IBM Developerworks HADR Wiki provides excellent insight into the nuances of monitoring HADR databases, covering areas of availability and performance. However, while an HADR standby database may be online and available, one or more tablespaces may be offline and unavailable. This condition has caught many database administrators by surprise after a TAKEOVER HADR operation.


An HADR standby database is in continuous replication with it's primary database by replaying transaction log data. If an error occurs during the replay of this log data on the standby database, such as a filesystem full condition or error, a tablespace on the Standby database will be put into an error state and log replay will stop for this tablespace. The Primary database will be unaware of this condition on the standby database, and applications accessing the primary database will continue on as business as usual. Because of this assumed health of the standby database, a subsequent Takeover operation results in the unexpected unavailability of tablespace data when this standby database becomes the primary database.


Monitoring for tablespaces in erroneous states on the Standby database was a little cumbersome prior to Db2 Version 10.5 fixpack9 or v11.1.1.1, as it requiring examining "db2pd -tablespaces" output on the standby database system and checking for an abnormal tablespace state value. Starting in Version 10.5 fixpack 9 or v11.1.1.1, monitoring this condition became much easier, as a new flag 'STANDBY_TABLESPACE_ERROR' was added to the HADR_FLAGS field of db2pd -hadr (or the MON_GET_HADR() table function) directly on the Primary database.


For more details about monitoring this error condition, please see new technote Monitoring and identifying tablespaces in invalid or error state, or tables in Inoperative state on the HADR Standby database.


Now that we've discussed the importance of monitoring for this condition, you're probably wondering how to best resolve the issue.

Prior to Version 10.5 fixpack9 or v11.1.0.0, resolving the issue required a full re-initialization of the standby database (ie. a full database backup image of the primary database must be restored on the standby database and hadr restarted).  For large databases this could take a considerable amount of time, and leave the primary database exposed without a disaster recovery counterpart.

Starting in Version 10.5 fixpack 9 (non-pureScale only) or v11.1.0.0, resolving the issue requires only the re-initialization of the erroneous tablespace(s).  For example, a tablespace backup image on the primary database can be restored on the standby database and hadr reactivated.  A full database backup restore is not required.  For large databases this can help to drastically reduce the time required to reestablish HADR disaster resilience.


For more details on how to recover from this condition using a tablespace backup image, please see technote How to recover from tablespace errors on an HADR Standby database.


I hope this information is useful. If you have any thoughts or questions, feel free to submit a comment below.


Sunday, 1 October 2017

Improve Db2 HADR Resilience of Network Transmission Corruptions

- David Sciaraffa, Software Development Manager – IBM Db2


In systems configured for disaster resilience through the High Availability Disaster Recovery (HADR) feature, a Primary database is coupled with one or more Standby databases. The Primary database will send transaction log data across the network to the Standby database(s), where this log data is replayed, allowing the Standby database(s) to stay synchronized with any changes that are made on the Primary database. HADR is one the most popular features of Db2, because of it's simplicity of setup, and requiring no application changes.

In order to achieve balance between data protection and performance, HADR supports several levels of synchronization.

HADR synchronization/protection levels:
SYNC: provides the highest level of protection. A transaction commit operation on the Primary database only returns back to the application if it’s transaction log data has been successfully written to disk on the Standby database. [This level usually has a noticeable performance impact versus other protection levels].
NEARSYNC: provides the next best level of protection. A transaction commit operation on the Primary database only returns back to the application if it’s transaction log data has been successfully received in memory on the Standby database.
ASYNC: A transaction commit operation on the Primary database only returns back to the application if it’s transaction log data has been successfully placed on the Primary database side tcp port to the Standby.
SUPERASYNC: A transaction commit operation on the Primary database always returns back to the application regardless of the status of the transmission of log data to the Standby database.

Sync modes are well documented in the IBM Developerworks DB2 HADR Wiki.

HADR log data process flow:
The underlying protocol and process flow for communication of transaction log data within an HADR system utilizes parallel processes in order to achieve high performance, and is thus not trivial.

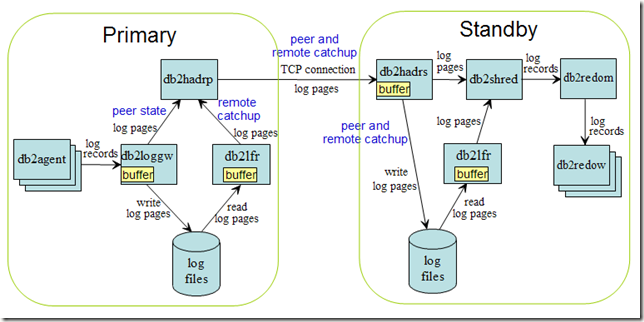
The diagram below (borrowed from the IBM Developerworks DB2 HADR Wiki) shows how a db2agent process (executing an application's sql operation) generates a transaction log record within an in-memory buffer of transaction log pages, one or more transaction log pages are asynchronously written to a transaction log file on the Primary database server by the db2loggw daemon, and in parallel these transaction log pages are sent over the network via tcp port by the db2hadrp daemon. The data is then received on the Standby database via the tcp port by the db2hadrs daemon, and then asynchronously written to a transaction log file on the Standby database by the db2loggw daemon, and in parallel sent to a db2shred daemon to parse and facilitate replay via other daemons on the Standby database.

hadr data flow diagram


Identifying network corruption errors:
The transmission of transaction log data across the network from the Primary to Standby database represents a potential point of failure. When networks are unstable or unreliable, this can manifest as the corruption of transaction log data or meta data during transmission.
The Standby database will typically fail with a "Log page checksum mismatch. pageLso xxxxxx, CheckSum xxxxxx" db2diag.log error message in Version 10.5 Fixpack 8 or earlier fixpacks; or "Bad page detected. The bytecount is incorrect" and "Bad page detected. Checksum mismatch…" errors in newer fix packs.

Network corruption errors and Crash Recovery failures on Standby database:
Some integrity checking of transaction log pages on the Standby database is always performed when the log pages are parsed by the db2shred daemon. While this does provide notification of integrity failure, it is possible that corrupted transaction log data can be written into the transaction log file on the Standby database before the integrity check failure is detected by the db2shred daemon. When the Standby database fails due to the transaction log page integrity check failure it will generate db2diag.log errors (as described above) and terminate. A subsequent restart of the Standby database (and implicit crash-recovery) will fail due to the same condition. To recover from this condition, typically a database administrator would need to either copy valid transaction log files from the Primary database, or reinitialize the Standby database.


Adding resilience to network corruption errors:
Starting in Version 10.5 Fixpack 9 and Version 11.1.3.3, more aggressive integrity checking can be enabled on the Standby database, along with automatic retry logic.

By enabling the DB2_ENABLE_HADR_LOG_PAGE_INTEGRITY_CHECK registry variable, integrity checking of transaction log data is performed by the Standby database db2hadrs daemon upon receiving log pages from tcp port, before they are written to log files by the db2loggw daemon or parsed by the db2shred daemon. When an integrity check failure is detected,  an error messages is printed into the db2diag.log (as described above), and the db2hadrs daemon will automatically attempt to have these log pages retransmitted from the Primary database.  This happens seamlessly from the application or administrator.

For more details on this new feature, please see:

Technote#2008073 - Improve Db2 HADR Resilience Through Network Data Integrity Checking and Retransmission


I hope this information is useful. If you have any thoughts or questions, feel free to submit a comment below.


Monday, 18 September 2017

Understanding Fallback Compatibility of Db2 Version 11.1 Fix Packs and Mod Packs

- David Sciaraffa, Software Development Manager – IBM Db2 Availability


Administration of most software systems require the periodic update of software levels. This will usually come as the result of proactively applying preventative fixes; the desire to use a new feature; or re-actively because an urgent fix is needed.

In Db2, software updates are provided in various ways, and an experienced database administrator will be familiar with each.


Db2 Software Delivery Vehicles

  • Version

A Db2 version or release is a momentous collection of new feature and functionality. Db2 Version 11.1 is the successor of Version 10.5, 10.1, 9.7, 9.5, 9.1, 8.2, 8.1, 7.2, 7.1, and so on. New Db2 versions are released on a periodic basis usually in the range of 18-32 months. Deploying new Db2 versions require an upgrade procedure to modify database meta data and catalogs. Fallback compatibility between Db2 versions is never possible (described later).

  • Modification Pack

A Db2 Modification Pack is also a collection of significant feature and functionality. However, it differs from a new version in that no upgrade procedure is required. Db2 modification packs are usually fallback compatible (described later).  At the time of this writing, the most recent modification pack of Db2 is "Version 11.1 Modification Pack 2 Fix Pack 2" (abbreviated as 11.1.2.2).  Prior to Version 11.1, Db2 did not use modification pack nomenclature.

  • Fix Pack and iFix

A Db2 Fix Pack is a collection of mostly stability fixes on a specific release or modification pack. The scope of these fixes are generally not significant and there is usually no new feature or functionality. Fix Packs are released on a periodic basis, usually approximately every 3-4 months for brand new releases, and stretching to approximately every 12 months for older mature releases. Prior to version 11.1 (before Db2 adopted the modification pack nomenclature), some Fix Packs did contain significant feature and because of this may not have been fallback compatible (described later).

An iFix is a type of Fix Pack, however the fixes included in an iFix are limited to those of highest impact and minimal risk.

  • Special Builds

A Db2 special build is a Db2 delivery vehicle used to include one or few fixes for problems which a customer has encountered. Often these fixes are new and not yet available in a fix pack. Special builds are usually not provided on a proactive basis. Special builds are built on top of the fixpack level which the customer has deployed, and often cumulatively built on top of an existing special build which was previously provided to the customer.

Special builds may also come in the form of 'Debug builds' which contain small changes to assist with the root cause determination of a problem, and are usually only temporarily deployed.


Fallback Compatibility

Planning for the deployment of a new version, modification pack, or fix pack will require a back-out strategy or plan. Once a database is running on a newer version/mod/fix pack, consideration is needed for whether the database data structures, backup images, and transaction log files are still compatible with the previous version/mod/fix pack.

A detailed technote has been published to describe the many nuances of fallback compatibility, and should help in the assembly of a back-out strategy:

Compatibility between DB2 for LUW Version 11.1 Mod-Packs and Fix-Packs:
http://www-01.ibm.com/support/docview.wss?uid=swg22003131


I hope this information is useful. If you have any thoughts or questions, feel free to submit a comment below.

Friday, 1 September 2017

Avoiding Lock Escalations and Improving Application Concurrency

- David Sciaraffa, Software Development Manager – IBM Db2 Availability


The concept and purpose of a database 'lock' should be well understood by all database administrators and application developers. Locks allow for multiple applications to access and manipulate database data at the same time.  Locks prevent race-conditions and provide the I in an A.C.I.D. compliant database - Isolation.

Locks, being conceptual in nature, come in many different forms and vary by database architecture. Most enterprise databases will have in common two fundemental types of locks: row lock and table lock. When a row within a table is being inserted, updated, deleted, or read, a row lock may be acquired. A lock on the entire table can also be acquired for some operations.  An application will hold locks for the duration of a unit of work, until a commit or rollback operation is performed (the unit of work is thus ended), at which point locks are released.


Isolation Levels

When a row is read from a table by an application, the isolation level of the application determines the type of lock required. The isolation level allows the application to dictate how data changes are isolated from other applications. For example, suppose an application A is inserting rows into a table but has not yet committed it's changes (meaning that it could cancel and rollback these changes at any time), while application B is reading rows from this table -- should application B be allowed to read the uncommitted data that is being inserted by application A?  Isolation levels allow the application to configure this behaviour, and more.

Isolation levels are well documented in the Db2 Knowledge Center. This developerworks article provides an excellent overview of isolation levels: https://www.ibm.com/developerworks/data/library/techarticle/dm-0509schuetz/


Finite Memory for Locks

Although locks are conceptual in nature, they are physically manifested within the database because a portion of database memory is used to manage and track locks.

The LOCKLIST configuration parameter is used to configure the quantity of database memory to use for managing and tracking locks.  By default this parameter is tuned by the Self Tuning Memory Manager and will increase and decrease with usage.

Another configuration parameter, called MAXLOCKS, allows the database administrator to configure the maximum percentage of locklist memory that a single application can use. This is meant as a safeguard to prevent a single untuned sql operation from consuming all the locklist memory.

Since locklist memory is finite in size, the database manager is only capable of managing a finite quantity of locks. So, how should the database behave when locklist memory is exhausted and no more locks can be acquired to service applications? Db2's default behaviour is to free locklist memory by performing lock 'escalation'.


Lock Escalation

Lock escalation is the process by which many row locks on the same table and associated with an application connection, are released and replaced by a single table lock associated to that application connection. Thus the locklist memory which was previously used by the many row locks becomes available for reuse.

While lock escalation is beneficial in that it allows the database to continue to grant new locks, it also has a negative side affect. By escalating to a single table lock associated to that application, other applications may no longer be able to access rows on this table (depending on their configured isolation levels).

For this reason, the frequency of lock escalations are monitored by experienced database administrators, and tuning is performed.  Lock escalations can be monitored by querying the LOCK_ESCALS value of the MON_GET_ACTIVITY() table function (as well as many other granular table functions).


Common Causes of Lock Escalation

The possible causes of lock escalations are easily described:

- When an application inserts/updates/deletes a very large quantity of rows in a single unit of work, a lock may be required for every row and this can exhaust locklist memory. Applications should never perform large batch I/U/D operations like this in a single unit of work, and should instead perform a commit operation after a small set of rows is processed, repeatedly. The lock_count value of the MON_GET_LOCKS() table function can be monitored periodically to identify any applications which hold an large quantity of locks.

- When an application is using a strict isolation level (such as 'Repeatable Read (RR)'), a lock will be required for every row read by that application. For queries of large data sets, this can exhaust locklist memory. Tuning options must be explored (such as splitting the query operation into multiple smaller queries, or having the application explicitly acquire a table lock ahead of time, or reducing the isolation level of the application if that acceptable from business perspective).  The lock_count value of the MON_GET_LOCKS() table function can be monitored periodically to identify any applications which hold a large quantity of locks.

- When locklist memory is not tuned by the Self Tuning Memory manager, it may simply be too small for the database workload. If the database administrator is not able to identify any applications which fit the two scenarios described above, then increasing the amount of locklist memory may be required. Estimating the ideal quantity of locklist memory is tricky and requires a deep understanding of application workloads and queries.  This technote (http://www-01.ibm.com/support/docview.wss?uid=swg21600309) may be beneficial in helping to make that estimate. However, usually when lock escalations occur due to locklist memory exhaustion, a database administrator will simply increase the locklist memory by some factor (say 25%-100%) and then continue to monitor the number of lock escalations.

- When the MAXLOCKS configuration value is configured extremely small, lock escalations will occur.  Since the intent of this configuration parameter is as a safeguard against runaway un-tuned queries, we generally see this value configured between 50% and 70%.


Forcing Lock Escalation Avoidance

When lock escalation problems are observed, a database administrator should always explore the cause and look for any tuning opportunities, as described earlier. Sometimes, queries and workloads are adhoc and beyond the control of the database administrator. In such scenarios, lock escalations are unpredictable and difficult to tune.

Starting in Db2 Version 11.1.2.2, a new feature called 'DB2_AVOID_LOCK_ESCALATION' provides control over lock escalation behaviour.  The feature is configured through a registry variable:

        db2set DB2_AVOID_LOCK_ESCALATION=ON
       
(the database or database manager does not require a restart for this setting to take effect).

When this feature is enabled and an application encounters the conditions where lock escalation would normally occur (ie. locklist memory is full, or MAXLOCKS limit reached) instead of performing lock escalation the application will receive an SQL0912N error. The application then has an opportunity to either perform a COMMIT or ROLLBACK to release the locks held by this application."

For more information on lock escalation avoidance, please see:

https://www.ibm.com/support/knowledgecenter/en/SSEPGG_11.1.0/com.ibm.db2.luw.admin.regvars.doc/doc/r0005665.html#P_DB2_AVOID_LOCK_ESCALATION


I hope this information is useful. If you have any thoughts or questions, feel free to submit a comment below.

Thursday, 3 August 2017

Access your database sooner after a system failure -- introducing DB2_ONLINERECOVERY!

- David Sciaraffa, Software Development Manager – IBM Db2 Availability


System failures happen. Modern enterprise IT stacks are complex feats of software and hardware engineering, encompassing billions of physical transistors and billions of lines of logical code comprising an almost infinite number computational permutations. These stacks run in data centers with physical attributes such as electrical utility and temperature conditions. Lest we forget the most vulnerable component of the IT stack - human error. Thus, system failures happen.


An enterprise database must be extremely resilient to system failures. Data loss or corruption are impermissible. Db2 has a distinguished history of resilience to system failures. It is truly best of breed. I'm proud to manage a team of talented developers focused on database recovery and availability.

Db2 recovery from a system failure begins when the database is restarted, and utilizes a process called 'crash recovery'. During crash recovery, any database changes which were previously committed by the application but not yet persisted to disk, are re-applied (we refer to this as the Forward-phase of crash recovery). Next, any database changes which were persisted to disk but not yet committed by the application, are undone (we refer to this as the Backward-phase of crash recovery). The Db2 transaction logs are processed to facilitate all this work.

Crash recovery processing is not isolated to system failures. In a database configured for disaster recovery via HADR, a TAKEOVER HADR operation on the Standby database must also perform crash recovery in order to undo any changes which were persisted to disk but not yet committed to the application.

While a database is performing crash recovery, it is not connectable by any application.

While the process of crash recovery provides database atomicity and durability in the event of a system failure, the process can take time to complete. For well tuned  applications crash recovery usually completes in a reasonable amount of time (ranging from near instantaneous to minutes) because the quantity of transaction log data to be processed is small. For poorly tuned applications, the quantity of log data to be processed can be large, and thus crash recovery can take a significant amount of time.


Well tuned applications and databases have some common themes:

- After changing data (like inserting, updating, or deleting) these applications perform a transaction commit operation expediently. By not leaving transactions open for a long time, this has the effect of reducing the total quantity of log data that needs to be processed if a crash recovery is required.

- Batch data changes are constrained to small manageable sizes. For example, if 1 million records need to be inserted into the database during a nightly batch, the application will perform this in smaller units of work of say 1 thousand records and then perform a transaction commit operation after each unit of work. By not generating single huge units of work, we reduce the quantity of transaction log data that needs to be processed if a crash recovery is required.

- The database is tuned to flush data changes to disk frequently. This is accomplished by configuring the PAGE_AGE_TRGT_MCR configuration parameter to a reasonable size in minutes. Since flushing data changes too frequent may overwhelm the system of i/o for heaving workloads, tuning this parameter will often require monitoring and adjustment. The DB2_USE_ALTERNATE_PAGE_CLEANING registry variable is a popular method of increasing the frequency of flushing data changes.

- Strict limitations are enforced on the size of transactions using the NUM_LOG_SPAN and MAX_LOG configuration parameters.

- The database is monitored proactively to identify any poorly tuned applications. The log_to_redo_for_recovery value of the MON_GET_TRANSACTION_LOG() table function can help to estimate the quantity of transaction log data required to process during crash recovery. The log span of uncommitted transaction can be monitoring using the db2pd-transactions, as described in the 'Determine the Size and Span of Uncommitted Transactions' section of this technote: http://thinkingdb2.blogspot.ca/2015/07/how-to-estimate-duration-of-takeover.html


While system failures seldom happen, most customers expect crash recovery to complete quickly. Since a database administrator can never fully prevent poorly tuned applications, a common customer request is for quicker accessibility to the database after a system failure, during crash recovery.

Our development team decided upon a solution which promised increase availability, without risking the distinguished resilience that Db2 has achieved over the decades.

The DB2_ONLINERECOVERY feature was rolled out in Db2 Version 11.1.2.2.

The feature allows for the database to become connectable once the forward phase of crash recovery has completed, while the backward phase of crash recovery is progressing. Tables which contain data changes that need to be undone during the backward phase of crash recovery will not be accessible to queries until the last of their data changes is undone.  All other tables are fully accessible to queries throughout the backward phase of crash recovery.

For more detailed information about this cool new feature, please see:

Database accessibility during backward phase of crash recovery or HADR takeover
https://www.ibm.com/support/knowledgecenter/SSEPGG_11.1.0/com.ibm.db2.luw.admin.ha.doc/doc/c0070281.html


I hope this information is useful. If you have any thoughts or questions, feel free to submit a comment below.

Wednesday, 12 July 2017

Reduce Problem Resolution Times with Persistent Db2 Diagnostic Data Collection

- David Sciaraffa, Software Development Manager – IBM Db2 Availability


In common lore spread throughout software engineering classes, the term ‘bug’ (referring to a software defect) was coined after a moth embedded itself within an electromechanical computer relay sometime during the infancy of computing. True or not, the almost infinite permutations of timing and procedural conditions in modern software stacks mean that software defects (bugs) are inevitable.


All software, including enterprise relational databases, are susceptible to software defects. The IBM Db2 support and development teams provide excellent assistance for a wide range of support issues, usage questions, best practices, and of course software bugs.

The complexity of software bugs will vary, and the more complex issues will often require specific diagnostic data leading up to the problem occurrence.  This means that, quiet often, there is insufficient diagnostic data during the first occurrence of a problem to determine the root cause, and the reproduction of a problem is required with diagnostic data collection in place for the time frame leading up to the problem.


The Db2 Persistent Data Collection Scripts help to reduce problem determination times, and often reduce the need for problem reproductions.

The scripts are available for download here: http://www.ibm.com/support/docview.wss?uid=swg22005477


In the spirit of agility, the scripts are simple ksh scripts, operational on both Linux and AIX platforms. They collect various diagnostics from both the Operating System, and from Db2. The Db2 diagnostics come from negligible-impact MON_GET* functions, and the db2pd tool (which is functional even when database connectivity is not possible).

The scripts are used by several extremely high transaction volume production database banking systems, with no performance impact.

There are three scripts in total:

Db2_dataCollect_minutely.sh – You should use a crontab or scheduler to execute this script about every minute or two. 
The diagnostic data collected by this script is stored into a staging folder and is automatically tarred and compressed (gzip) upon completion (with exceptional compression ratios, so data volumes are manageable).

Db2_dataCollect_hourly.sh – You should use a crontab or scheduler to execute this script about every hour. 
The diagnostic data collected by this script is stored into a staging folder and automatically tarred and compressed (gzip) upon completion (with exceptional compression ratios, so data volumes are manageable).

Db2_dataCollect_archive_purge.sh – You should use a crontab or scheduler to execute this about script every 24hours.
This script will move the diagnostic data from the staging folders (where the collection scripts above store their diagnostic data) into an archive folder. It will then delete any files older then a retention period (default 30 days) from the archive folder.


In future blog posts, I hope to provide details on how database administrators can utilize the diagnostic data collected by these scripts.  Seasoned DBAs will be familiar with much of the information collected here and find it useful for self analysis.  Db2 support analysts will find it extremely useful in the triage of a multitude of problems.


Your feedback is always welcome. If you have any suggestions, corrections or recommendations, or would like to monitor for updates to these scripts, please subscribe to the public community for Db2 Persistent Data Collection Scirpts:
https://www.ibm.com/developerworks/community/groups/service/html/communitystart?communityUuid=a294bddb-9ded-4757-8d5e-ca5ba173e2cd

Translate